Gifting Tool Reporting and Analytics Features
Most gifting platforms only measure sends, not the revenue outcomes that actually matter.

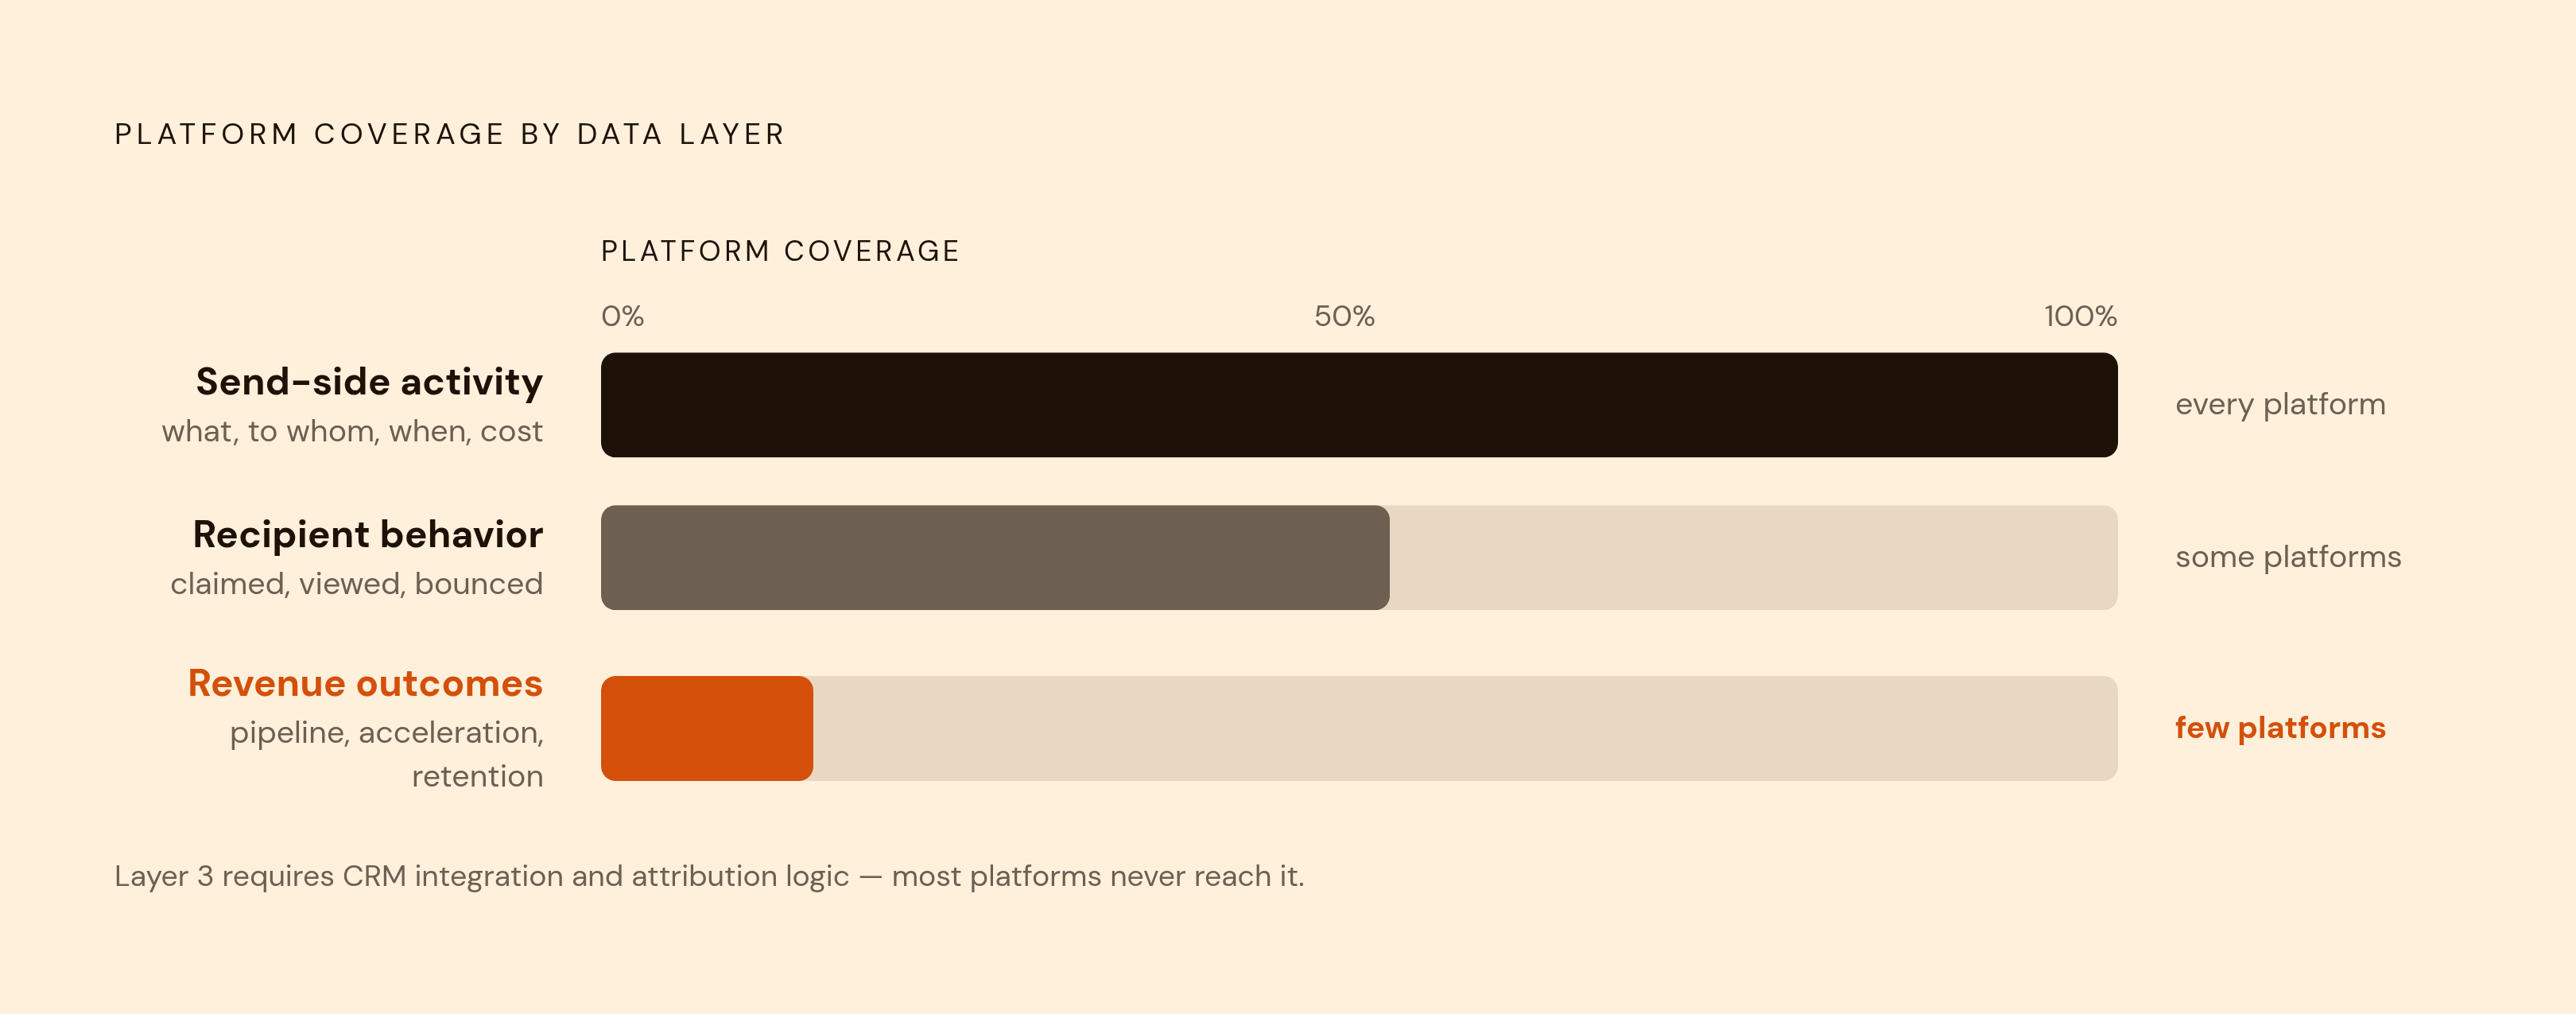
Gifting data lives across three layers, and the straightforward thing to say upfront is that most platforms only cover the first one.
The first is send-side activity: what was sent, to whom, when, at what cost. Table stakes. Every gifting tool has this.
The second is recipient behavior: was the gift claimed, viewed, bounced, or sitting unclaimed in a queue somewhere? This is where platforms start to thin out, and where the signals that actually matter begin to appear.
The third is revenue outcomes: did the send move pipeline, accelerate a deal, influence retention? This layer requires CRM integration, attribution logic, and a willingness to wire gifting into the same measurement infrastructure the rest of revenue operations runs on.
But what if a platform claims to cover all three? What separates a useful reporting layer from a decorative one is whether it actually traverses all three and connects them inside the CRM, so each send produces a data point rather than just a shipment confirmation.
Teams running gifting across marketing, sales, customer success, and HR need a unified surface. Not four separate CSV exports that someone reconciles in a spreadsheet on a Friday. That is the architecture question worth asking before anything else.
Delivery and redemption tracking as the foundation of everything else
Before you can attribute pipeline to a gift, you need to know the gift was actually received. This sounds obvious until you look at how many platforms stop at "shipped."
Redemption analytics matter because pipeline numbers take weeks or months to mature. Redemption data is available almost immediately, which makes it the earliest reliable signal you have that a program is working or not.
Most platforms worth serious consideration should surface at minimum: redemption rate (gifts claimed divided by gifts sent), claim velocity (how quickly recipients move from notification to claim), delivery success rate, and a count of gifts that were viewed but not claimed. That last one is undervalued. A recipient who opened the notification and didn't claim is not the same as one who never saw it. The first is a follow-up cue; the second is a deliverability problem. Treating them identically in your reporting flattens two very different situations.
Bounce points within the claim flow carry diagnostic value too. Drop-off at address entry is a friction problem. Drop-off at gift selection is a relevance problem. The diagnosis changes the response entirely, so the platform needs to surface where in the flow recipients are abandoning, not just that they abandoned.
It is also worth considering what a low redemption rate is actually telling you. A low redemption rate on an otherwise well-designed campaign points toward something specific: wrong gift, wrong audience, poor timing, or a friction point in the claim experience. The platform should surface these metrics per campaign, per sender, per recipient segment. Aggregate numbers are comfortable. Segmented numbers are useful, and sometimes uncomfortable in exactly the right way.
Address verification, real-time delivery tracking, these are prerequisites rather than differentiators. A platform that can only confirm a gift shipped, not that it arrived, cannot connect it to anything downstream. You are back to operating on assumption.
CRM integration and how gifting activity becomes pipeline data
Gifting activity that lives only inside the gifting tool is invisible to the revenue stack. The rep doesn't see it. The deal record doesn't reflect it. The campaign influence model can't touch it. It happened, technically, but it happened off the books.
"We integrate with Salesforce" covers a wide range of implementation quality, so it is worth being specific about what a native integration should actually do.
At a baseline: every send, claim, and delivery logs automatically as a CRM activity on the contact and account record. Reps can trigger sends from within the CRM without switching platforms. Campaign member statuses sync back so gifting maps to existing campaign influence models. Attribution data pulls into CRM dashboards so pipeline reports reflect gifting touches.
At a more sophisticated threshold: sends fire automatically when a deal stage changes, a field updates, or an intent signal arrives from a third-party source. When a target account crosses an intent threshold, a well-integrated platform can queue a send and log it in Salesforce without requiring any rep action. The gifting program runs inside the sales process rather than alongside it.
This matters for adoption as much as it matters for measurement. Asking a rep to log into a separate tool to send a gift is asking them to add a step to an already crowded workflow. The integration removes that friction by putting the gifting action inside the system they are already in. And adoption is not a soft concern; programs with poor CRM integration predictably see lower rep participation in early quarters, because friction compounds.
The goal is that every send has a timestamp, a recipient, a deal association, and an outcome, making gifting as auditable as any other revenue activity. If the platform cannot get a program there, the measurement problem remains unsolved regardless of how good the dashboard looks.
Campaign-level and sender-level performance reporting
Program managers need two distinct reporting dimensions. Conflating them produces conclusions that don't hold up.
Campaign-level reporting asks how a specific play performed against its goal. A post-demo follow-up gift is a different play with different success criteria than a renewal save gift or a cold outreach gift. Each deserves its own performance view. Core metrics should include send volume and cost, redemption rate and claim velocity, meeting acceptance rate for gifted versus non-gifted outreach, pipeline influenced and sourced per campaign (which requires that CRM sync to already be in place), and deal velocity comparison between gifted accounts and a control group.
Sender-level reporting asks a different question: which reps or marketers are executing gifting well, and which aren't sending at all? Per-sender metrics around sends initiated, redemption rate, and pipeline generated surface whether the program has structural adoption problems or whether performance is concentrated in a small subset of the team. Both situations require different responses, and you cannot see either without this second dimension.
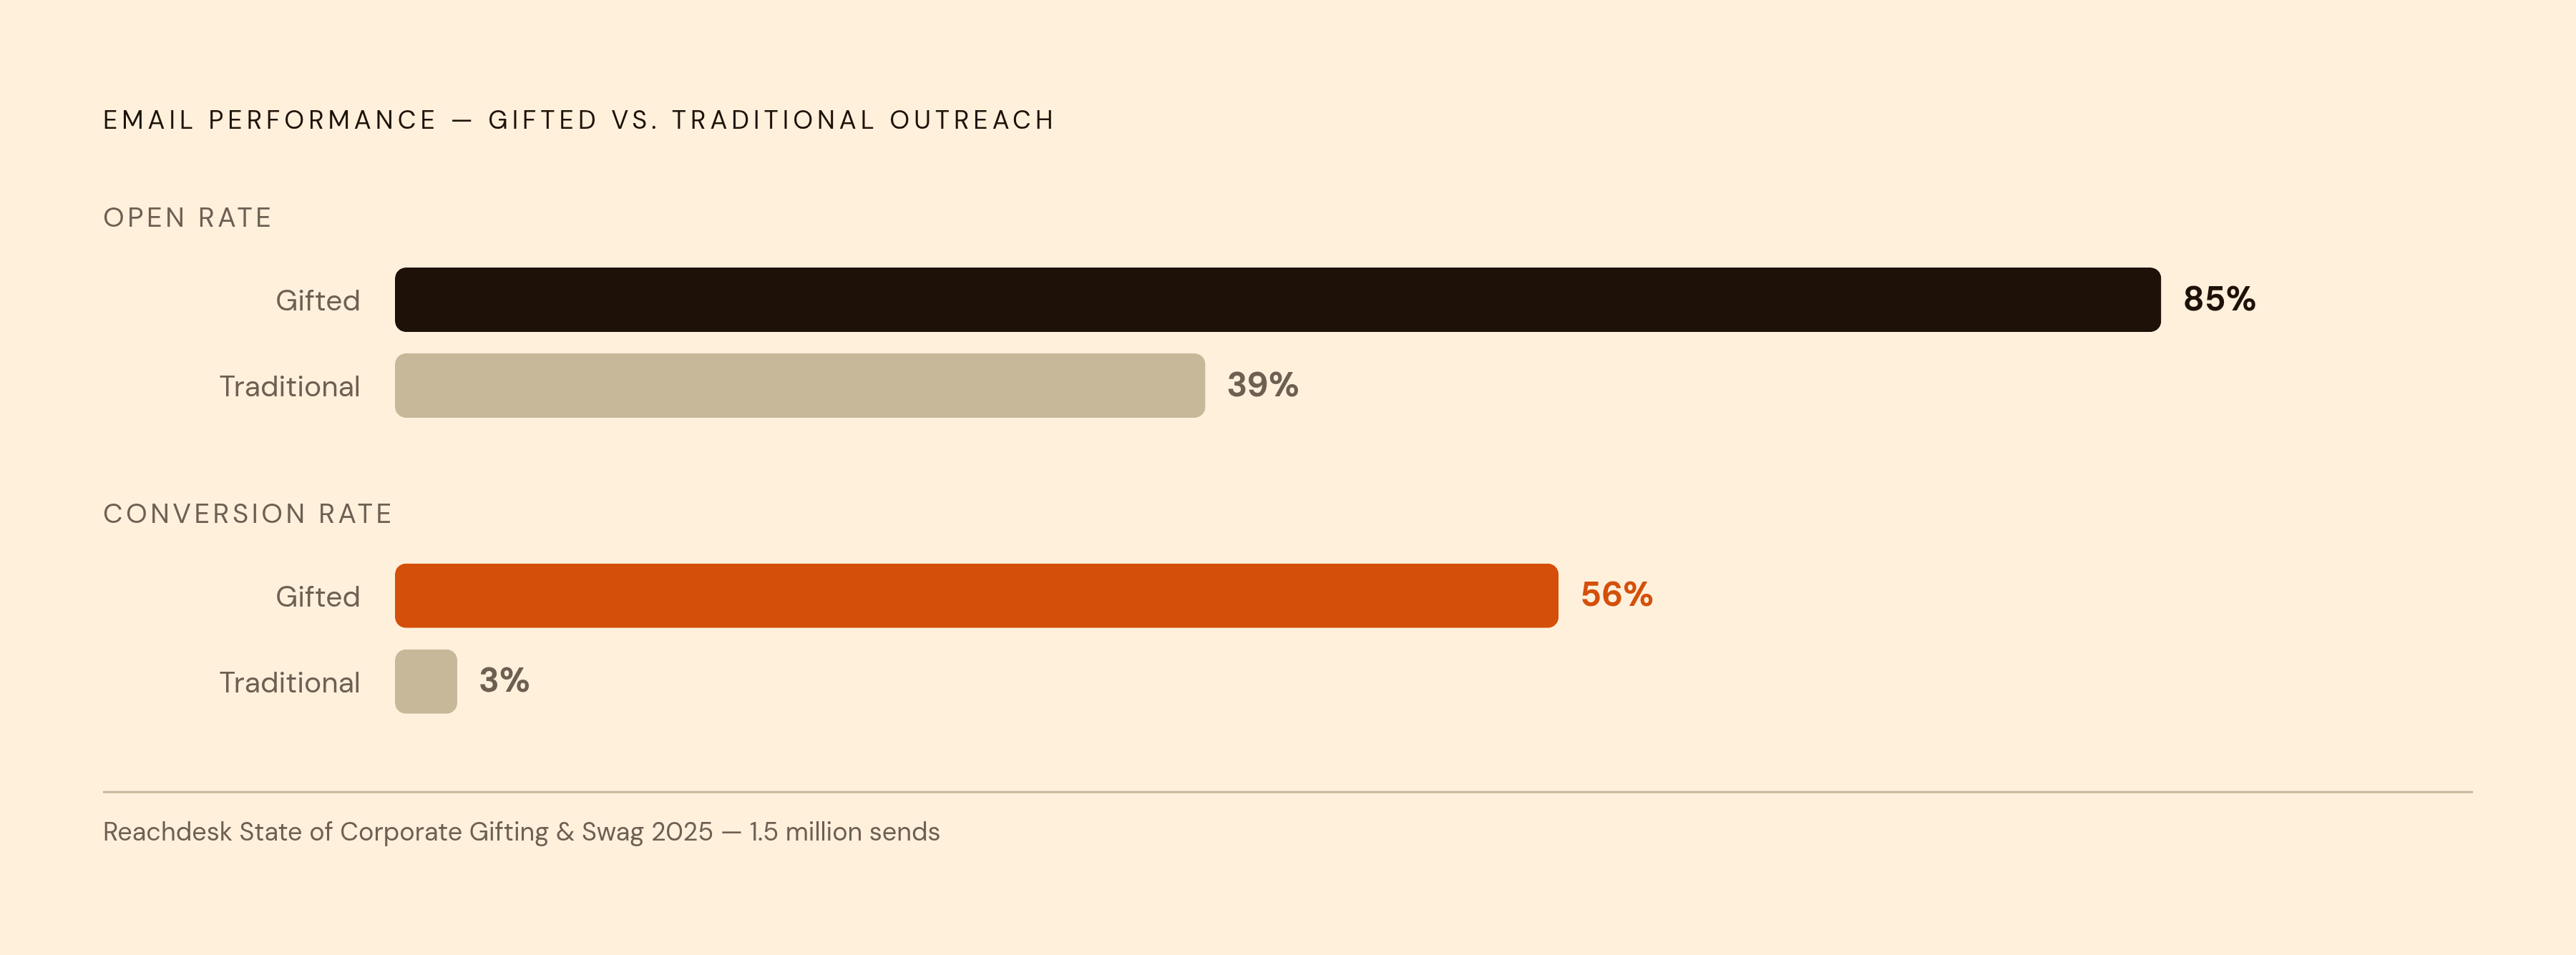
Industry research based on 1.5 million sends found that gifted email campaigns achieve 85% open rates versus 39% for traditional email, and 56% conversion rates versus 3% for standard outreach. Those are the platform-wide benchmarks against which your own campaigns should be measured. That raises an important question: are you benchmarking against platform-wide averages or only against your own internal history? Benchmarking against platform-wide averages provides a standard that carries more credibility in a business review than showing improvement over last quarter in isolation. "We improved" is weaker than "we are performing at or above industry benchmark."
Attribution models and what each one tells you
Attribution is where gifting reporting breaks down in one of two directions. Teams either claim too much, attributing closed revenue to every gift that touched a deal, or they concede too little, treating gifting as inherently untrackable. Neither posture survives scrutiny.
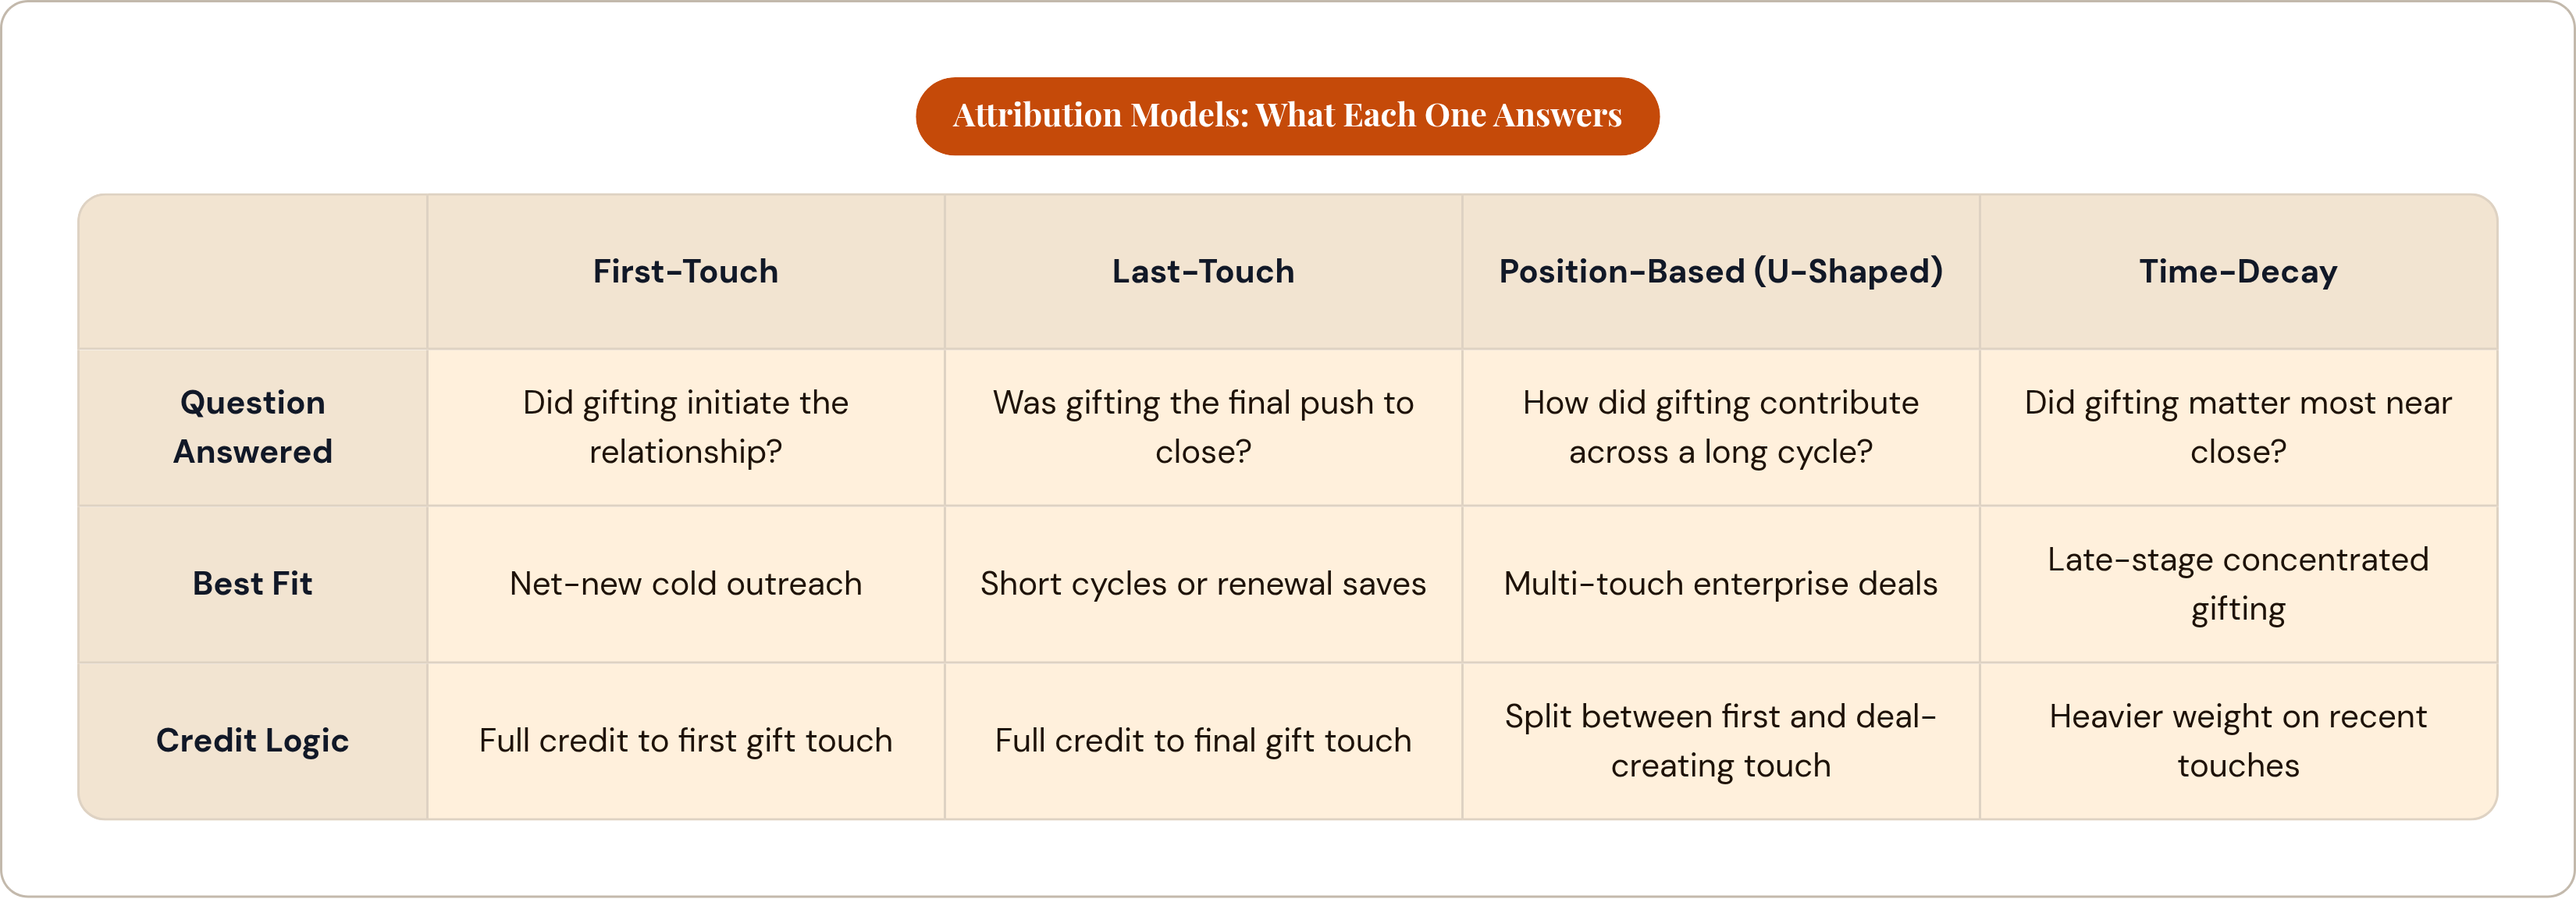
Four models each answer a different question, and understanding the difference matters before picking one.
First-touch attribution gives the gift full credit if it initiated the relationship. This is appropriate for net-new cold outreach plays where the gift was the opening move.
Last-touch attribution gives the gift full credit if it was the final touchpoint before close. This suits short sales cycles or renewal saves where gifting is explicitly the intervention at decision time.
Position-based (U-shaped) attribution splits full credit between the first touch and the deal-creating touch, distributing the remainder across middle interactions. This fits multi-touch enterprise deals where gifting appears at multiple stages across a longer cycle.
Time-decay attribution weights recent touches more heavily. Useful when gifting concentrates late in the sales cycle and the team wants the credit allocation to reflect recency.
The model matters less than consistency. Switching attribution logic between quarters makes quarter-over-quarter comparison meaningless because you are no longer measuring the same thing. Platforms should support at minimum first-touch and multi-touch attribution, and the CRM campaign structure already in place determines which model is even architecturally possible before you start.
Influenced pipeline is the most defensible metric for gifting programs, precisely because it does not require gifting to be the singular cause of a deal. It only requires that gifting was a contributing touchpoint, which is a far easier case to make to a skeptical CFO and a considerably more accurate representation of how complex sales actually close.
Budget tracking, cost accounting, and the ROI calculation teams actually need
The most common reporting failure in gifting programs is not a missing metric. It is a misrepresented cost. Teams show spend without showing value, or they show pipeline influence numbers without accounting for total program cost. Finance notices the gap, and the program's credibility erodes.
Total cost includes more than the face value of the gift. Fulfillment and shipping costs accumulate quickly across a high-volume program. Unclaimed and undelivered gifts represent full cost with zero revenue impact, and they are rarely broken out as a distinct line item. Admin and coordination time is almost always omitted; per Huggg's guidance, a well-run program should account for time saved as part of the ROI calculation, which means time spent also needs to be included when costs are carefully assessed. Platform licensing should be allocated proportionally to the program being measured.
Budget-tracking features worth evaluating: per-send cost visibility broken down by gift, fulfillment, and shipping as separate components rather than a single line; budget remaining by team, campaign, or rep allocation; spend-to-pipeline ratio; and the ability to track and recover or reroute unclaimed gift spend rather than letting it disappear into a write-off.
The industry-level finding that more than half of companies report increased sales after launching gifting programs is only meaningful as a benchmark, not as evidence for any specific program's contribution. ROI reporting should output something the CFO can read directly: total spend, total influenced pipeline, total closed revenue touched by gifting, cost per meeting, cost per closed deal. That is the format that holds up in a quarterly business review, and it is the format that distinguishes a program from a line item.
How AI-assisted analytics changes what teams can ask of their data
Traditional gifting dashboards require someone to know exactly what question to ask and exactly where to look. This creates a predictable failure mode: the person who needs the insight doesn't have time to pull the report, so the insight never surfaces, and the program continues on inertia rather than evidence.
AI-assisted analytics changes that interaction. Teams query program data in natural language and receive explanations rather than raw exports.
In practice, this means a revenue leader can ask which campaigns drove the most pipeline last quarter and receive a readable answer without a manual report pull. A program manager can ask which gifts had the lowest redemption rate this month and surface underperformers immediately. Anomaly detection can flag when a campaign's redemption rate drops significantly below baseline without waiting for a scheduled review cycle to catch it three weeks later.
Some platforms operate on this model, connecting to program data and answering natural-language questions about gifting performance, returning explanations and charts rather than raw tables. The CFO question ("what did we spend and what did it produce?") gets an immediate, readable answer rather than a multi-tab spreadsheet.
AI-powered gift recommendation engines also feed back into analytics in a way that closes an important loop. If the platform tracks whether AI-recommended gifts outperform manually selected ones on redemption rate and pipeline influence, then the selection intelligence and the outcome data are connected. You learn not just what happened but whether the decisions driving the program are improving over time, which is a materially different kind of insight.
The practical shift is that analytics stops being a reporting task that happens after the quarter ends and becomes a decision-support layer that informs the next send while the program is still running.
Employee and people-team reporting alongside revenue metrics
People operations teams are running gifting programs at real scale: new hire onboarding, work anniversaries, promotions, wellness recognitions, distributed team milestones. The measurement gap here is, if anything, sharper than in revenue programs. The 1.6% formal ROI tracking figure from Huggg's 2026 UK benchmarks applies directly to employee gifting, where spend is often substantial and justification is often entirely anecdotal, the kind that sounds reasonable in a budget meeting until someone asks for the number behind it.
The metrics people teams need are structurally similar to what revenue teams need, but oriented differently. Milestone send completion rate asks whether every eligible employee actually received a send on time, not just whether sends were initiated. Redemption rate by employee segment reveals whether certain teams or geographies are not claiming gifts, which can indicate relevance problems, communication failures, or cultural mismatches worth investigating before they become something larger. Over time, pairing gifting activity data with eNPS or pulse survey results creates a longitudinal view of whether the program is moving the needle on the outcomes it claims to support.
Global delivery success is particularly relevant for distributed and international teams, where address complexity, customs considerations, and local logistics can create meaningful drop-off that aggregate numbers obscure. A strong overall delivery rate looks fine until you realize that your entire London office and your APAC team account for most of the shortfall.
The same 2025 industry report found that 70% of gift recipients report feeling more valued by the sending company, and 61% report a more positive brand perception. But how does this affect our original promise? People teams need their own program's numbers to make that case, not just the industry benchmark borrowed from someone else's data.
A platform that siloes employee reporting separately from revenue reporting forces manual stitching. Companies where the same gifting budget and the same platform are touching both sales pipeline and employee experience simultaneously need a unified reporting surface. That is not a nice-to-have; it reflects how these programs actually operate.
What to look for when evaluating a gifting platform's analytics depth
The distance between basic send logs and full-funnel attribution is significant enough to change what a program can credibly claim at budget time. Here is how to pressure-test a platform across the layers that matter.
Delivery and redemption. Does the platform confirm delivery, not just shipment? Are redemption rate, claim velocity, and bounce data available per campaign, not only in aggregate? Can you see where in the claim flow recipients are dropping off?
CRM and pipeline. Does gifting activity sync as CRM data automatically, without manual export? Can the platform support both Sourced and Influenced pipeline reporting? Does it maintain attribution consistency across periods so comparisons remain valid?
Budget and cost. Does per-send cost visibility break out fulfillment and shipping separately from gift face value? Can unclaimed gift spend be tracked and recovered or rerouted, rather than simply written off?
Program management. Are campaign-level and sender-level reports available without custom SQL or a data export to an outside tool? Is there benchmarking against platform-wide averages, not just internal history?
AI and intelligence. Can the platform answer natural-language questions about program performance? Does it surface anomalies and underperforming campaigns before a scheduled review cycle would catch them?
The underlying test, across all of it: can a program manager walk into a quarterly business review and answer, without a manual report pull, how much was spent, what it influenced, and what it produced? If that question requires scrambling the night before, the platform is generating activity data. The goal is business intelligence, and there is a real difference between the two. One tells you what happened. The other tells you whether it was worth it, and what to do differently next quarter.